Top 15 Inbound Call Center KPIs and Customer Service Metrics
June 21, 2022 | Convoso
Contents
Share this article
Today, more than ever, running an inbound call center is all about data and metrics. And not just any inbound metrics, but the right ones. Without the correct measurements and monitoring, you will struggle to deliver the level of service your customers expect.
However, with so much focus being placed on mitigating agent learning, maintaining customer satisfaction, and raising profits, the critical KPIs that most closely correlate with better results often get lost in the mix. In this guide to customer service metrics, we break down the top inbound call center KPIs your business should be tracking.
Inbound call center key performance indicators (KPIs) measure the efficiency and effectiveness of your contact center, as well as the success of your overall customer service experience. Keeping a close watch on the top metrics we describe below can give you insights into how well you are responding to and solving customer issues and inquiries—and ultimately, help predict how well you serve and retain your most important asset: your customers.
Related Content
Making outbound calls? Get the 16 Essential KPIs & Metrics for Outbound Call Center Profitability
15 Inbound Call Center KPIs and Metrics to Measure Your Customer Service and Performance
1. Customer Satisfaction Score (CSAT)
Just like its name suggests, CSAT is a key customer service metric that attempts to score overall satisfaction with your business’s service and products. While still very important in their own right, each of the metrics we cover below will impact your overall CSAT score. For that reason, whether you’re a BPO call center servicing your clients’ customers or an inbound customer service center handling cases directly, CSAT is likely to be one of, if not the, most important inbound metric you track.
Taking steps to ensure your customers are happy and satisfied is critical to eliminating and avoiding high customer churn. Whether it’s enhancing the skill level of your agents or automating your inbound call flow, everything you do as a company should be focused on attaining customers AND keeping them satisfied.
By ignoring this top-line customer satisfaction metric you are leaving the door wide open for a competitor to treat them right. Keeping your CSAT high requires consistency. Even with your most loyal customers, it only takes a slip-up or two to send them packing. A study from CX platform provider Emplifi found 86% of consumers will leave a brand they were once loyal to after only two to three bad customer service experiences.
How it’s calculated:Total number of happy customers / Total number of customers surveyed
2. Customer Churn Rate
Providing consistent, high-quality customer service is one of the most effective ways to retain customers and add to your profits. The alternative—acquiring new customers—can cost your business five times as much. Increasing customer retention by just 5% can increase profits by up to 95%.
That’s why customer churn rate, also known as attrition rate, can tell you so much about the performance of your business and your inbound call center. This customer service KPI should be on every decision-maker’s radar, as it gives direct insight into how many customers have stopped doing business with you over a given period.
How it’s calculated: (Customers at the beginning of the month – Customers at the end of the month) / Customers beginning of the month
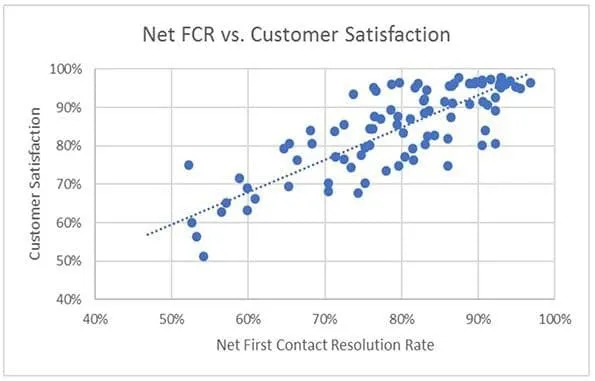
3. First Call Resolution (FCR)
Your operation’s First Call Resolution Rate (FCR) is a strong indication of how knowledgeable your agents are and how efficient your call center process is for your customers. The more customer issues your agents can resolve during their initial point of interaction, the higher your FCR rate will be. As a result, your operation will also be more productive as well.
For the sake of fully understanding the value and importance of the FCR metric, let’s put ourselves in the shoes of a customer. No matter what, there always comes a time where the only way to resolve an issue is by calling into customer support hotline. No matter who you are, you want to get connected to an agent as quickly as possible who can resolve your issue as quickly and efficiently as possible. Each agent or waiting period added to the process, the less satisfied you’ll be with the service. As illustrated in the graph below, from Metric Net, FCR & CSAT scores have a direct correlation:
How it’s calculated: Total number of cases resolved first time / Total number of cases handled by agents
4. Transfer Rate
Your call center’s transfer rate highlights how often a customer needs to be redirected to a better-skilled or better-fitting agent for their needs. Measured as a percentage, a high transfer rate indicates your operation could benefit from a detailed audit of your entire inbound call flow and process. Transfer rate can also speak to the efficacy of your contact center software and setup: are your IVR and automation system directing customers to the direct department? Is your LMS ineffectiveness resulting in high transfer rates?
Similar to a poor FCR, high transfer rates reflect inefficiency within your call center. (In fact, a higher FCR is directly correlated with a lower transfer rate.) Needing multiple employees to solve one issue is bad for any business—and this is especially true in an environment where customers want instant solutions.
How it’s calculated: (Total number of calls transferred / Total number of calls handled) x 100
Related Content
Running a blended call center? What to look for in a blended dialer solution for inbound and outbound marketing
No matter how great your hold music is, odds are your customer has something better to do than sit for hours listening to scratchy old jazz. In an age of one-click shopping and instant gratification, customers expect speedy resolutions. In a recent study of customer experiences, 58% of those surveyed said they have higher expectations now than they did a year ago. And of these consumers expecting more, 67% said faster customer service was crucial. Having your customers waiting in queues will most likely only result in irate and frustrated customers — who end up searching for a more efficient and effective alternative. Your call center’s average speed to answer (ASA) gives you a customer service KPI to monitor performance in this area.
How it’s calculated: Total wait time for answered calls / Total # of answered calls
6. Agent Idle Time (Agent Status)
Agent idle time is a widely overlooked inbound call center metric throughout the industry. This KPI reflects how often your agents are on task. It allows you to answer questions like: how often are your agents actually on calls? Are your agents following up with the customers they need to? Are your agents always on “Not Ready”?
A lot of inbound metrics are service and support-facing. However, this one speaks well to the efficiency and success of a call center’s inbound sales teams. It also gives decision-makers insight into their call center’s ROI. Payroll is always going to be one of, if not the, biggest call center costs. The more time your agents spend idling, the more of your call center’s money is just going up in smoke. That’s why this is one inbound call center KPI that should be on every dialer manager’s custom reporting dashboard.
How it’s calculated: Agent’s total idle time across the day / Total number of interactions
Related Content
Are you getting the best return on your call center software investment?
Many call centers overlook preparation. Agents should be equipped and skilled enough to take on the increased call workloads driven by new product releases, landing page success, or even just time of day. Call center managers should always adjust their staffing models to the times of day their customers call in the most frequently, as well as how long these calls typically take. Without accurate predictions of changes in call volume, your other customer service KPIs or agent morale could take a hit.
Given as a positive or negative number, forecasting accuracy reflects the difference between expectations and reality. Typically, managers forecast their volumes on a half-hourly basis in order to properly staff their inbound call center throughout the day. If the forecasting accuracy number is positive—or “calls offered” are above the predicted number of calls—then metrics like ASA, abandonment rates, and ultimately CSAT—may be more likely to decrease. If the number is negative, managers will know payroll is being spent inefficiently, and agent morale and readiness may suffer.
Improving forecasting accuracy all begins with accurate call center reporting. Use the data available to you to see the hours your customers are calling in most frequently. Plan your campaigns ahead of time and be transparent with your agents about expected increases in workload.
How it’s calculated: ((Calls offered – Forecasted calls offered) / Forecasted calls offered) x 100
8. Average Age of Query
In many industries, and especially in the B2B world, customer issues can be quite complex. They may not always be easy to resolve immediately. This doesn’t necessarily have to create customer satisfaction issues—and that’s where the average age of query metric for customer service can come in handy.
This inbound call center KPI reflects the average length of time that a customer query or issue goes unresolved. Issues that are not resolved on the first contact begin to “age,” and although having some aging queries isn’t a negative thing in and of itself, the goal of your call center should still be to reduce your average age of query KPI. Additionally, ongoing reporting from agents can help give you a sense of why queries are not being resolved immediately.
How it’s calculated: Total time current queries have remained open / Total number of open queries
9. Agent Turnover Rate
Agent burnout and turnover is a pervasive issue for today’s call centers. One study showed that as many as 74% of contact center agents are at risk of burnout. And an incredible 30% are at risk of severe burnout.
On the one hand, fighting against burnout is a matter of empathy for call center businesses. The onus is on decision-makers to acknowledge the high stress sometimes associated with customer service work and accommodate employee concerns. On the other, burnout and turnover are far from just a problem for the agents it affects. High agent attrition comes with high direct costs like onboarding and training, but it also comes with indirect costs like decreases in customer dissatisfaction and lost revenue.
Lowering agent turnover rates begins with an effective, organized onboarding process. By incorporating gamification, call centers can boost overall engagement. Managers should always be paying close attention to the happiness of their employees and looking for effective ways to motivate agents.
How it’s calculated: (Total number of agents who left position during given time / Average number of total agents employed during the same period) x 100
Self-service accessibility is not necessarily a concrete customer service metric, but it’s still crucial for businesses to keep an eye on. Customers’ ability to address issues themselves has a huge effect on overall customer service efficiency and customer satisfaction. After all, it’s something that today’s customers expect. A Gartner report shows that 70 percent of customers use self-service channels to resolve their problems.
Identify opportunities to improve self-service at your business by utilizing dispositions and the data in front of you to tell you why your customers are frequently calling in. Then, dig deeper with surveys that ask customers what information they find lacking and what sorts of resources might improve their experiences. Robust knowledge bases, content hubs, FAQ pages, community forums, and even AI-powered virtual agents can all help customers solve issues and reduce the load on your agents.
How it’s calculated: Self-service accessibility is a qualitative measure of how easily customers can solve their issues through self-service.
11. Average Call Duration
Average call duration is a metric that can help the flow of your call center. Simply put, call duration is the average length of time your agents are on call with a customer. Oftentimes, integrating features like an IVR, advanced dynamic scripting, detailed dispositions, and CTI screen-pops can be extremely influential in giving your agents the best ability to solve your customers’ needs. This increased ability can sometimes be accompanied by a decrease in average call duration.
How it’s calculated: Total call time / Total number of calls handled
12. Average After-Call Work Time
Not all customer service work happens over the phone. That’s why inbound call centers need this customer service metric at their disposal. Average after-call work time, or wrap-up time, measures the amount of time agents spend handling customer issues and requests after finishing a call.
A high after-call work time KPI may be evidence of inefficient work processes, unclear guidelines, a need for additional employee coaching, or even cumbersome software. And particularly in high-volume contact centers, every extra second of after-call work can really add up. Not only can it be a drag on the number of available agents, affecting ASA and other metrics, but it can also hinder agent performance by causing them to rush through subsequent customer interactions. For these reasons and more, poor performance against this KPI can have a domino effect and an outsized impact on overall customer service.
How it’s calculated: Total after-call work time / Total number of calls handled
13. Average Handle Time
Average handle time (AHT) is similar to call duration, however, it incorporates every second your customer is in contact with your company, as well as your agents’ after-call work time. As a result, at certain call centers, it can be a more effective measurement of how efficiently your team is able to resolve customer issues. Getting this overall number down gives your agents more chances to talk to customers and, overall, delivers a better experience for your customers
How it’s calculated: (Total talk time + Total hold time + After-call work time) / Total number of calls
14. Percentage of Calls Blocked
If you’re running an inbound or blended call center, the only thing that might be worse than subjecting customers to long waits is not being able to take their calls in the first place. The percentage of calls blocked metric is one customer service KPI that you absolutely must keep as low as possible. The percentage of calls blocked measures the number of inbound calls that receive a busy tone or are sent straight to voicemail. Blocked inbound calls can often be a reflection of larger issues at your call center: like improperly configured call queues or software that can’t handle the necessary call volume.
How it’s calculated: (Total number of calls blocked / Total number of inbound calls received) x 100
Widely known as the most important metric for businesses and call centers alike, the Net Promoter Score, or NPS, reflects a customer’s willingness to recommend a company’s product or services. Initially developed by consulting giant Bain & Company in the early 2000s, NPS is reported as a number between -100 and +100, with a higher score being better.
How it’s calculated: To generate an NPS, customers are surveyed and asked to rank the likelihood they would recommend a given product or service to a friend or colleague on a scale of 0 (not at all likely) to 10 (extremely likely). Respondents are then divided into 3 categories:
Promoters scored 9-10
Passives scored 7-8
Detractors scored 0-6
To get the final NPS score, you simply subtract the percentage of Detractors from the percentage of Promoters.
Of course, while calculating the metric is simple, generating sufficient data—and doing so regularly enough—requires a significant amount of legwork. Organizations like SurveyMonkey and Qualtrics offer sample templates that can simplify and kick-start the process of gathering this crucial customer satisfaction metric.
Similar to the CSAT score which kicked off our list, the Net Promoter Score is ultimately a sort of “metric of metrics.” Everything your contact center does feeds into your NPS. Make positive progress against the other crucial inbound call center KPIs we’ve detailed here, and you’ll likely make gains against the most important one—your NPS.
Find out how Convoso can increase productivity and improve KPIs for blended call center operations. Schedule a demo today.